- Research
- Open access
- Published:
Evaluation of in vitro antioxidant, anticancer activities and molecular docking studies of Capparis zeylanica Linn. leaves
Future Journal of Pharmaceutical Sciences volume 7, Article number: 76 (2021)
Abstract
Background
Capparis zeylanica Linn. leaf extract was subjected to phytochemical screening for the determination of antioxidant and anticancer activity on (MCF-7) human breast cancer cells. The phytoconstituents previously determined were subjected to molecular docking studies against human epidermal growth factor receptor 2 (HER2) protein as a target receptor to support antioxidant and anticancer activities.
Results
Powdered plant leaves were extracted by maceration method using ethyl acetate, chloroform, methanol, ethanol and distilled water. Preliminary phytochemical evaluation and total phenolic and flavonoid content of the extract were evaluated using biochemical tests. Total antioxidant capacity of the extract was evaluated using different assays. Anticancer potential of methanolic and ethanolic extracts was studied on human breast cancer cells. Molecular docking studies were performed to evaluate the binding interactions of phytoconstituents on HER2 protein using AutoDock Vina.
Phytochemical evaluation confirmed the presence of saponins, flavonoids, tannins, phenols, carbohydrates and proteins. Ethanolic extract showed a maximum total phenolic and flavonoid content in support with antioxidant and anticancer activities. The ethanolic leaf extract showed 66.63% cell growth inhibition against MCF-7 cells. Molecular docking studies revealed the highest binding affinity (− 8.4 Kcal/mol) of α-amyrin followed by quercetin and β-carotene. Glucocapparin, syringic acid, vanillic acid and p-coumaric acid showed almost a similar binding affinity to the amino acid residues of HER2 protein as compared to 5-FU.
Conclusion
C. zeylanica leaf extract showed the presence of phenolic and flavonoid constituents responsible for antioxidant and in vitro anticancer activities. Molecular docking studies showed the binding affinity of phytoconstituents on targeted HER2 protein.
Background
Cancer is recognized as a leading cause of death. Many cancer treatments such as chemotherapy, surgery and radiotherapy are available to treat cancer, although severe side effects remain a concern. Cancer is usually associated with accumulation of mass of cells resulted from poor signal transduction across pathways due to overexpression of epidermal growth factor receptors. Breast cancer generally occurs in women and rarely in men. As per Globocan 2018, breast cancer stands second of all cancers for a cause of death. The international agency for research on cancer released the estimates in 2018 on the global burden of cancer. The global burden was raised to 18.1 million new cases and 9.6 million deaths in 2018 [1]. In India, more than 11.5 million cases were detected with all types of cancers. Out of which, 14% deaths were associated with breast cancer. Since then, newer techniques in detection and treatments were developed, such as chemotherapy, radiation therapy and surgery. But these were contributed with severe side effects. Chemotherapy is the treatment of choice in most of the cancer cases rather than radiation and surgical operations [2, 3]. Medicinal plants have always remained a choice of treatment in many diseased conditions with the availability of isolated novel phytoconstituents with minimum side effects. According to the World Health Organization reports, 252 drugs were approved for cancer treatment, out of them 11% drugs were of plant origin [4].
C. zeylanica Linn., family Capparidaceae, is widely distributed throughout India, China, Nepal, Bangladesh, Malaysia and Pakistan. The leaf extracts are suggested for the treatment of dysentery, diabetes and rheumatism [5]. Pharmacologically, ethanol and methanol extracts of roots of C. zeylanica showed promising in vitro antioxidant activities [6] The leaves of C. zeylanica exhibit immunostimulant [7] antidepressant [8] and antimicrobial [9] activities.
The free radicals are reactive oxygen species responsible for the cause of cancer [10] Antioxidants are the chemical constituents which either delay or prevent the oxidation process of free radicals in the body. The present study was aimed at evaluation of anticancer potential of C. zeylanica Linn. leaf extract. The preliminary screening of phytoconstituents responsible for antioxidant activity was done based on the total phenolic and flavonoid content of the extract. The plant was not researched out for the anticancer activity in human breast cancer cells. Thus, an attempt was made to evaluate antioxidant activity by 2,2-diphenyl-1-picrylhydrazyl (DPPH) assay and anticancer activity of C. zeylanica Linn. leaf extract against MCF-7 cells. The molecular docking studies of phytoconstituents of C. zeylanica Linn. on human epidermal growth factor receptor (HER2) protein revealed the binding affinity with the amino acids within proximity of active sites of HER2 protein [11]
Methods
Materials
Aluminium chloride, ethyl acetate, chloroform, ethanol and methanol were purchased from Lobachemie. Butylatedhydroxytoluene (BHT), Trolox, gallic acid and quercetin were purchased from Sigma-Aldrich. 2,2-Diphenyl-1-picrylhydrazyl (DPPH), molybdate reagent, dimethyl sulfoxide (DMSO), Dulbecco’s modified Eagle’s medium (DMEM), actinomycotic 100X solution and ascorbic acid were purchased from Thermo Fisher Scientific.
Collection and authentication of the plant part
The plant C. zeylanica was collected from the rural area in Kolhapur district, Maharashtra, India. The plant was identified and authenticated (MB/RW/02/013) by Dr. M. Y. Bachulkar, Ex-Principal and Taxonomist, Department of Botany, Shri Vijaysinha Yadav Arts and Science College, Kolhapur, Maharashtra. A fresh leaves were collected, washed and dried in shade for 2–3 weeks. Dried leaves were blended to fine powder and stored in airtight container and used for further studies.
Preparation of crude extract
A 50 g of powdered crude drug was subjected to extraction by maceration method using ethyl acetate, chloroform, ethanol, methanol and aqueous solvents for 6–8 days to extract soluble compounds [12, 13]. Filtered the liquid using filter paper and concentrated the extracts. Concentrated extracts were collected and stored at 4 °C until further use.
Phytochemical analysis
The preliminary phytochemical evaluation of the extracts was done using different biochemical tests as per reported method [14]. Further, ethanolic and methanolic extracts of C. zeylanica were selected for further studies based on the qualitative analysis from five extracts.
Estimation of total phenolic content
The total phenolic content of C. zeylanica was estimated by the Folin-Ciocalteu reagent method [15] with slight modification. Briefly, 200 μl of methanolic and ethanolic extracts were added in equal volume of Folin-Ciocalteu reagent (tenfold diluted) and incubated for 10 min. Then, 1.25 mL of aqueous sodium carbonate was added to neutralize the mixture, incubated for 45 min at 37 °C with intermittent shaking to generate colour. Distilled water was used as a blank. The extracts were analysed for total phenolic content by measuring the blue colour at 765 nm using UV-Vis spectrophotometer (UV-2700i/2600i, Shimdzu, Japan) in triplicate. Gallic acid was used as a reference standard for calibrating the method of analysis and to construct the calibration curve. The total phenolic content of the extract was calculated from the linear equation of calibration curve of gallic acid, in terms of milligram per gram of gallic acid equivalent (GAE) of dry extract.
Estimation of total flavonoid content
The total flavonoid content of C. zeylanica was estimated as per the procedure reported [16]. Briefly, 0.5 mL of methanolic and ethanolic extracts were mixed with equal volume of 2% AlCl3 and incubated at room temperature for about 1 h. Evaluation of extract samples was carried out at a final concentration of 1 mg/mL. Quercetin was used to construct the calibration curve, and the total flavonoid content was calculated as milligram per gram quercetin equivalent (QE). The results were carried out in triplicate by measuring absorbance at 420 nm. The procedure was repeated as above for both the extracts.
Determination of total antioxidant capacity (TAC)
The total antioxidant capacity of C. zeylanica leaf extracts was determined by the phosphomolybdenum assay using the method described by an earlier report [17]. Briefly, 1.0 mL of different concentrations of methanolic and ethanolic extracts (100 to 500 μg/mL) was mixed with 3.0 mL phosphomolybdenum reagent containing 28 mM sodium phosphate and 4 mM ammonium molybdate in 0.6 M sulphuric acid in capped test tubes. Distilled water was added to make the final volume to 5 mL. The test tubes containing mixture was incubated for 90 min in a water bath set at 95 °C in dark. After incubation, the mixture was cooled at room temperature and absorbance of resulting solution was measured in triplicate at 695 nm against ethanol and methanol as blank using UV-visible spectrophotometer. The TAC results were expressed as Trolox equivalents (mg TE/g of dry extract). Butylatedhydroxytoluene was used as reference controls.
DPPH scavenging assay
The free radical scavenging activity of C. zeylanica leaf extract was estimated by the DPPH as per earlier reports [18], with slight modifications. One milliliter of different concentrations of methanolic and ethanolic extracts ranging from 100 to 500 μg/mL was added in each test tube containing 2 mL 1.0 mmol/L DPPH solution. Ascorbic acid solution was prepared separately with the same procedure as a standard. All test tubes were incubated at room temperature for 30 min in dark. The absorbance was measured at 517 nm. The lower the absorbance of reaction mixture, the higher is the free radical scavenging activity. The percentage free radical scavenging activity was calculated using the following equation:
where Ac is the absorbance of the control (1 mL of ethanol with 1 mL of DPPH solution) and At is the absorbance of the test sample. The results were analysed in triplicate.
Cytotoxicity study
Human breast cancer cell line, MCF-7, and human breast cell line, MCF10A, were procured from the National Centre for Cell Science, Pune, India. The cells were subcultured in Dulbecco’s modified Eagle medium (DMEM) with low glucose having phenol red supplemented with 10% fetal bovine serum and 1% penicillin/streptomycin solution to minimize the microbial contamination. The cells were seeded at a density of 5 × 10³ cells/well in a 96-well flat bottom microplate and maintained at 37 °C in 5% CO2 incubator with 95% humidity overnight prior to the experiment. The cells were treated with different concentrations (500, 250, 125, 62.5, 32.75 μg/mL) of methanolic and ethanolic extracts by serial dilution method. Initially, cells were diluted with serum-free medium to achieve twice the desired maximum test concentration. The cells were incubated for another 48 h, and cytotoxicity was evaluated using the 3-(4,5-dimethylthiazol-2-yl)-2,5-diphenyl tetrazolium bromide (MTT) assay [19, 20]. MTT assay was initiated with 5 × 10³ cells/well, 20 μL of the MTT staining solution (5 mg/mL) in phosphate buffer solution was added to each well and plate was incubated at 37 °C for 4 h. After incubation, the medium was removed and subsequently added with 100 μL DMSO in each well to dissolve the formed formazan crystals. The absorbance was measured at 570 nm using micro plate reader (BioRad, India) in triplicate [21, 22]. The percentage cell inhibition was calculated using equation as.
The inhibitory concentration (IC50) value for the extracts was determined based on the concentration of extract inhibiting the cells by 50% of its initial cell population.
Molecular docking studies
The molecular docking studies were performed to determine the chemical interactions of the phytoconstituents of plant C. zeylanica Linn. with targeted protein responsible for breast cancer. Molecular docking was initiated by drawing 3D structures of phytoconstituents, considered as ligands and prepared, energy minimized. The target protein HER2 was downloaded from RCSB (PDB id: 1N8Z). The protein was prepared and refined using MMCF-2 forcefield. All the heteroatoms were removed from crystal structure of protein to make all the complex receptors free of ligand before docking using PyMOL-2.3.4 software. AutoDock Tools (version-4.2.6) software was used for the preparation and optimization of protein and ligand molecules. Water molecules were removed, and polar hydrogens and Kollman charges were added in the protein molecule. Since ligands were small molecules, Gasteiger charge was added. The binding site of the protein was selected by selecting a grid box with dimensions size (X = 8.820, Y = 91.432, Z = 127.425) and docked using AutoDock vina (version 1.1.2) [23]. All the AutoDock vina docking runs were performed in Intel Centrino Core2Duo CPU @ 2.20 GHz of IBM system origin, with 4 GB DDR2 RAM. AutoDock vina was compiled and run under Microsoft Windows 10 operating system. The results were analysed on the basis of binding affinity of ligand with the protein and refined mean standard deviation. Images of protein-ligand binding confirmations were visualized and processed using Discovery studio visualizer 2020 software. 2D structures of constituents were drawn using Chemdraw Professional 16.0.
Statistical analysis
The data were expressed as mean ± standard deviation of results obtained from three independent experiments. P ≤ 0.05 was considered significant for all the represented results. All the graphs were plotted using OriginPro 9.1 software.
Results
Total yield of crude extract
The percentage yield of crude extracts obtained from C. zeylanica leaves using different solvents like ethyl acetate, chloroform, ethanol, methanol and water was 15.12%, 8.62%, 17.33%, 21.15% and 14.75%, respectively, by maceration method.
Phytochemical analysis
Preliminary phytochemical evaluation of C. zeylanica leaf extract (ethyl acetate, chloroform, ethanol, methanol and aqueous) showed the presence of a variety of phytochemical constituents. Proteins were found to be present in all five extracts while saponins, flavonoids, tannins, phenolic compounds and carbohydrates were found in ethyl acetate, ethanol, methanol and aqueous extracts. Alkaloids, fats and oils were found in chloroform extract (Table 1). Based on total percentage yield, polarity, solvent compatibility and phytochemical evaluations, ethanolic and methanolic extracts were selected for the further studies.
Estimation of total phenolic content
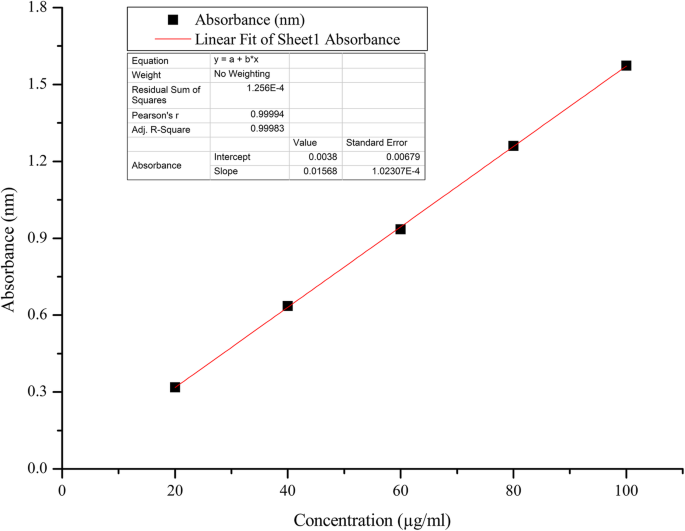
The total phenolic content of ethanolic and methanolic extracts of C. zeylanica leaves was estimated by Folin-Ciocalteu reagent method and expressed as milligram per gram gallic acid equivalent (GAE). The total phenol content obtained in the ethanolic extract was 59.13 ± 1.45 mg/g GAE and that in methanolic extract was 48.43 ± 0.15 mg/g GAE. All the values were calculated using linear regression equation of gallic acid (Fig. 1).
Estimation of total flavonoid content
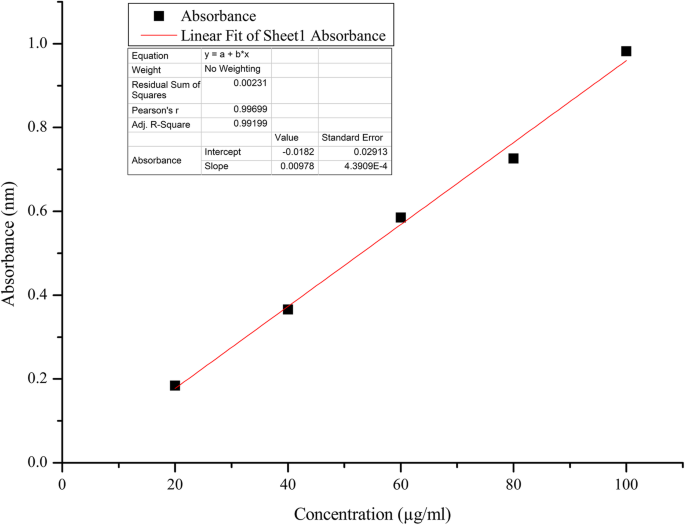
The total flavonoid content present in the ethanolic extract of C. zeylanica leaves was 36.87 ± 0.45 mg/g QE while methanolic leaf extract was found to exhibit 32.25 ± 0.45 mg/g QE calculated using linear regression equation of quercetin (Fig. 2).
Determination of total antioxidant capacity
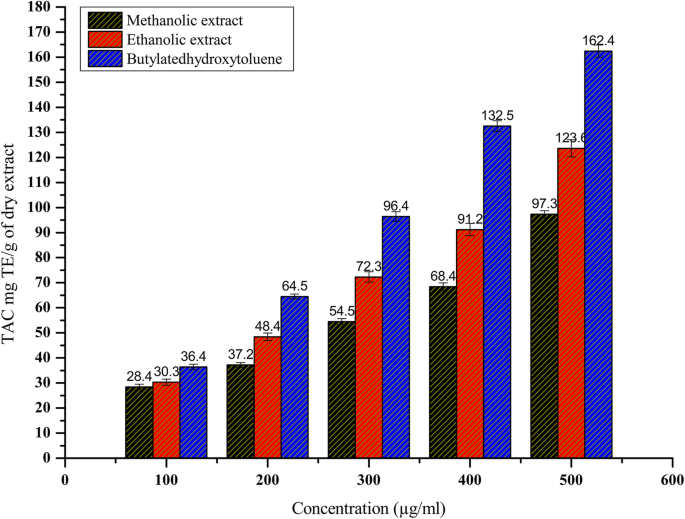
Total antioxidant capacity of the ethanolic and methanolic extracts of C. zeylanica leaves were determined by the phosphomolybdenum assay using BHT as a reference standard. The results were expressed as concentration of extracts against TAC mg TE/g of dry extract. The reduction of phosphate-molybdenum (VI) to phosphate-molybdenum (V) on reacting with phytochemicals from extracts to produce green molybdenum complex was correlated to the amount of TAC mg TE/g of dry extract. From (Fig. 2), the methanolic extract (97.3 ± 1.4 mg TE/g) showed comparatively low antioxidant capacity than the ethanolic extract (123.6 ± 3.4 mg TE/g) and reference standard BHT (162.4 ± 4.2 mg TE/g) at 500 μg/mL. The ethanolic extract showed significant TAC in comparison to BHT which depicted greater antioxidant potential among other extracts due to excess phenolic compounds. The extracts were found to show increase in mg TE/g of dry extract with an increase in the concentrations of methanolic and ethanolic extracts (Fig. 3).
DPPH scavenging assay
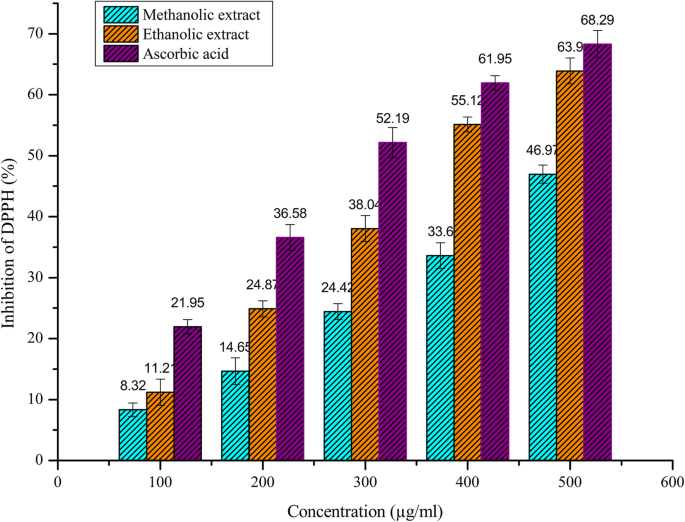
DPPH is a free radical at room temperature and becomes a stable diamagnetic molecule on reaction with electron or hydrogen radical. The lower the absorbance of reaction mixture, the higher is the free radical scavenging activity. In the present study, methanolic and ethanolic extracts of C. zeylanica leaves were subjected to DPPH radical scavenging assay and the antioxidant activity of extracts were compared with standard ascorbic acid. The ethanolic extract was found to have comparatively high free radical scavenging activity than methanolic extract (Fig. 4).
Cytotoxicity study
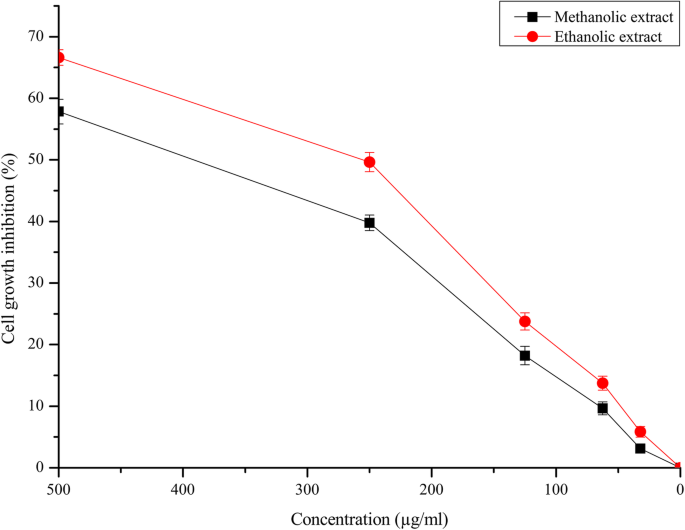
Cytotoxicity of extracts of C. zeylanica leaves on MCF-7 cells was determined by MTT assay. MTT assay measures the reduction of yellow-coloured MTT by mitochondrial succinate dehydrogenase. In the present work, MTT was reduced to insoluble and dark, purple-coloured formazan with the phytoconstituents present in C. zeylanica leaves extracts. As the reduction of MTT can occur only in metabolically active cells, the level of activity was considered as an indicator of the cell viability. The result of MTT assay revealed that the ethanolic and methanolic extracts of C. zeylanica leaves decreased the percentage of cell viability. The extracts showed cytotoxic effect in the form of cell growth inhibition against MCF-7 cells. In case of ethanolic extract, increase in the cell growth inhibition was observed with an increase in concentration and showed significant cell growth inhibition, 66.63% at 500 μg/mL, while methanolic extract showed a slightly less activity in comparison to ethanolic extract (Fig. 5). However, both the extracts showed non-cytotoxic effect against normal cells (MCF-10A). The IC50 value of methanolic and ethanolic extracts was found to be 233.4 μg/mL and 199.0 μg/mL, respectively, which indicated a promising anticancer activity against MCF-7 cells.
Molecular docking studies
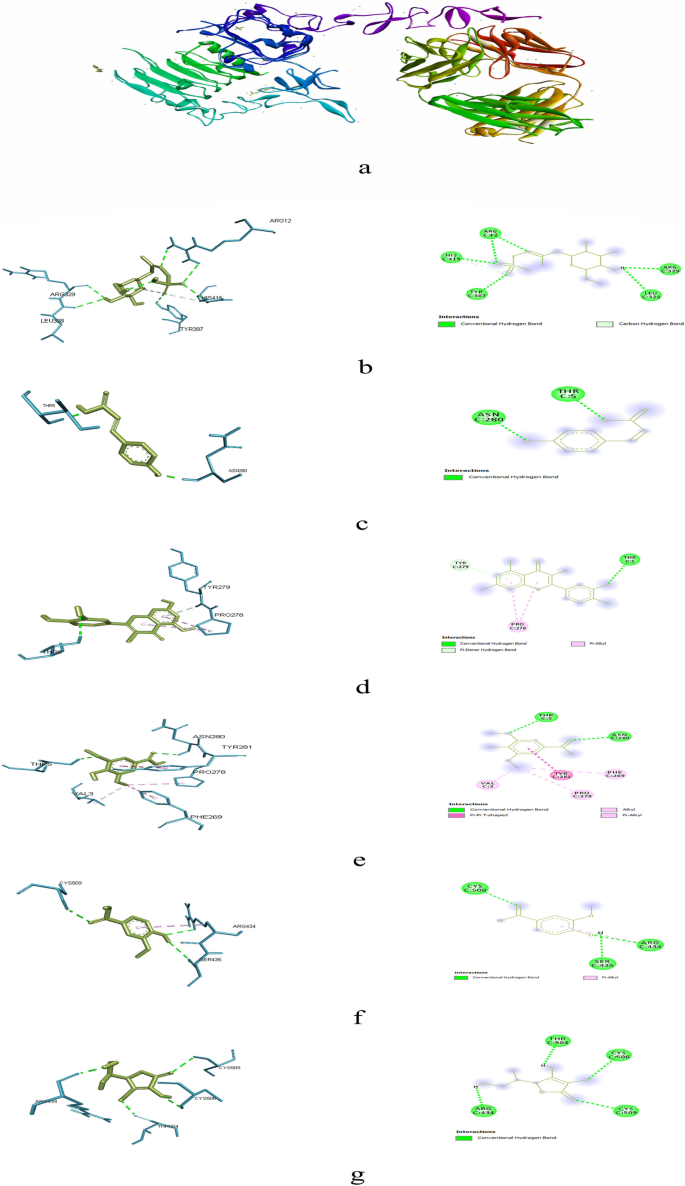
Molecular docking studies were performed to determine the binding interactions of phytochemical constituents of C. zeylanica extracts with HER2 using software AutoDock vina (version-1.1.2). HER2 receptor is concerned with positive breast cancer. All the phytochemical constituents were docked with HER2 along with 5-fluorouracil (Table 3) to determine comparative binding interactions [24]. The results were presented in the various docking parameters (Table 2). From the results, binding affinity was found to be significant for α-amyrin, ß-carotene and quercetin (− 8.4 to − 6.9 Kcal/mol). Glucocapparin, quercetin, syringic acid, vanillic acid and p-Coumaric acid (Table 3) showed maximum hydrogen bonds (≥ 2) while 5-FU showed 4 H bonds. The stable confirmations of all the ligands with HER2 protein with corresponding bond lengths were represented in (Fig. 6, Table 2).
a Crystal structure of extracellular domain of human HER2 (PDB id.: 1N8Z); Molecular interactions of the 2D and 3D confirmations of selected ligands showing significant binding affinity and hydrogen bond interactions (≥ 2). b Glucocapparin, c p-Coumaric acid, d quercetin, e syringic acid, f vanillic acid, g 5-FU complexed with Herceptin Fab
Discussion
Cancer is recognized globally as a life-threatening disease, and breast cancer is the most common cause of death in women [1]. In the present study, methanolic and ethanolic extracts of C. zeylanica leaves were found to have shown significant anticancer activity against human breast cancer cells. Preliminary phytochemical evaluation of ethyl acetate, ethanol, methanol and aqueous extracts indicated the presence of saponins, flavonoids, tannins and phenolic compounds and carbohydrates and proteins. Methanolic extract exhibited the presence of alkaloids, steroids, fats and oils (Table 1). The phytochemical constituents in leaf extract of C. zeylanica were studied to exhibit various medicinal activities such as for the treatment of dysentery, curing cough and cold; as a rubefacient; as counterirritant and as antidiarrheal [5]. So far, phenolic- and flavonoid-containing compounds have shown anticancer activity in various cancer cells [25, 26]. Estimation of total phenolic content and total flavonoid content provides measurement of total antioxidant capacity and antioxidant activity which in turn is correlated with anticancer potential of the plant. The total phenolic content in ethanolic extract and methanolic extract of C. zeylanica leaves were 59.13 ± 1.45 mg/g GAE and 48.43 ± 0.15 mg/g GAE, respectively, which indicate the plant-rich source of phenolic compounds. Further, the total flavonoid content in ethanolic extract and methanolic extract of C. zeylanica leaves were 36.87 ± 0.45 mg/g QE and 32.25 ± 0.45 mg/g QE, respectively. The presence of phenolic and flavonoid compounds was responsible for antioxidant activity of the plant [25, 26].
Reactive free radicals in physiology of living cells play an important role in triggering diseased conditions under stressed conditions. As the free radicals are considered toxic in biological system, the effect of free radical scavenging activities of plant extracts are necessarily determined. In the present study, the plant extracts were evaluated for total antioxidant capacity and antioxidant activity using phosphomolybdenum assay and DPPH assay. In the present study, DPPH assay served a significant indicator for potential antioxidant activity based on % inhibition of DPPH (Fig. 4). The graph plotted between concentration and percentage inhibition of DPPH showed increase in antioxidant potential of extracts with an increasing concentration of extracts under study. Ethanolic extract showed comparatively high percentage inhibition than methanolic extract.
MTT assay was performed to screen the in vitro cytotoxicity of C. zeylanica leaves’ extract against MCF-7 cells [19, 20]. MTT assay measures the detection of reduced, insoluble, dark purple-coloured formazan solution. For the assay, different concentrations of extract showed decrease in cell viability with the increase in the concentration of extracts. The percentage cell growth inhibition was markedly increased from 5.84% at 32.75μg/mL to 66.63% at 500μg/mL of ethanolic extract which was comparatively higher than methanolic extract. The IC50 value of ethanolic extract of C. zeylanica leaves against MCF-7 cells was 199.0 μg/mL. However, no any cytotoxicity was observed for extracts of plants against normal breast cells (MCF10A).
Molecular docking studies revealed docking interactions of phytochemical constituents of C. zeylanica extracts with HER2 protein. From the results, it was found that α-amyrin showed the highest binding affinity (− 8.4 Kcal/mol) followed by quercetin and β-carotene in comparison with 5-FU. However, other constituents like glucocapparin, p-Coumaric acid, syringic acid and vanillic acid showed (≥ 2) hydrogen bonds to the amino acid residues of HER2 protein. On the basis of above results, it has been found that the ethanolic extract of C. zeylanica leaves has significant antioxidant and cytotoxic potential against cancer cells which was in support with the docking analysis.
Conclusion
The ethanolic and methanolic extracts of C. zeylanica leaves showed the presence of phenolic and flavonoid contents with significant antioxidant and cytotoxic effects. The molecular docking studies on HER2 protein revealed the binding interactions of phenolic and flavonoid compounds of the extracts with target protein and supported the results of antioxidant and anticancer activities. In addition, further research is required to explore the scientific evidences to support the anticancer activity of extracts of C. zeylanica leaves by performing in vivo studies.
Availability of data and materials
The datasets used and/or analysed during the current study will be available from the corresponding author on reasonable request.
Abbreviations
- C. zeylanica :
-
Capparis zeylanica
- HER2:
-
Human epidermal growth factor receptor
- BHT:
-
Butylatedhydroxytoluene
- DPPH:
-
2,2-Diphenyl-1-picrylhydrazyl
- DMSO:
-
Dimethyl sulfoxide
- DMEM:
-
Dulbecco’s modified eagle’s medium
- ALCL3 :
-
Aluminium chloride
- MTT:
-
3-(4,5-Dimethylthiazol-2-yl)-2,5-diphenyl tetrazolium bromide
- IC50 :
-
Inhibitory concentration
- RCSB:
-
Research collaboratory for structural bioinformatics
- PDB:
-
Protein data bank
References
Bray F, Ferlay J, Soerjomataram I, Siegel RL, Torre LA, Jemal A (2018) Global Cancer Statistics 2018: GLOBOCAN estimates of incidence and mortality worldwide for 36 cancers in 185 countries. CA Cancer J clin 68(6):394–424. https://doi.org/10.3322/caac.21492
Rahman M, Sahabjada AJ (2017) Evaluation of anticancer activity of Cordia dichotoma leaves against human prostate carcinoma cell line, PC3. J Tradit Complement Med 7(3):315–321. https://doi.org/10.1016/j.jtcme.2016.11.002
Onishi T, Sasaki T, Hoshina A (2018) Intermittent chemotherapy is a treatment choice for advanced urothelial cancer. Oncology 83:50–56
Kalebar VU, Hoskeri JH, Hiremath SV, Hiremath MB (2020) In-vitro cytotoxic effects of Solanum macranthum fruit. Dunal extract with antioxidant potential. Clinical phytoscience 6:24
Gayatri Devi V, Anitha J, Selvarajan S (2015) Physico-chemical standardization and review on Capparis zeylanica Linn., A common sidhha herbal drug. World J Pharm Res 4(5):588–599
Macwan CP, Patel MA (2010) Antioxidant potential of dry root powder of Capparis zeylanica Linn. Int J Pharm Pharm Sci 2(3):58–60
Ghule BV, Murugananthan G, Nakhat PD, Yeole PG (2006) Immunostimulant effect of Capparis zeylanica Linn. leaves. J Ethnopharmacol 108(2):311–315. https://doi.org/10.1016/j.jep.2006.03.041
Mishra SK, Singh PN, Dubey SD (2011) Evaluation of CNS depressant activity of Capparis zeylanica Linn. root. Res J Med Plants 5(6):738–746. https://doi.org/10.3923/rjmp.2011.738.746
Chopade VV, Tankar AN, Ganjiwale RO, Yeole PG (2008) Antimicrobial activity of Capparis zeylanica Linn. roots. Int J Green Pharm 2:28
Adebiyi OE, Olayemi FO, Ning-Hua T, Guang-Zhi Z (2017) In vitro antioxidant activity, total phenolic and flavonoid contents of ethanol extract of stem and leaf of Grewia carpinifolia. Beni-Suef Univ J Basic Appl Sci 6(1):10–14. https://doi.org/10.1016/j.bjbas.2016.12.003
Gutierrez C, Schiff R (2011) HER2: biology, detection and clinical implications. Arch Pathol Lab Med 135(1):55–62. https://doi.org/10.5858/2010-0454-RAR.1
Dhabale PN, Shrikhande VN, Sakharkar DM (2012) Physicochemical and phytochemical evaluation of Capparis zeylanica Linn. IJPSR 3:198–200
Dhanani T, Shah S, Gajbhiye NA, Kumar S (2017) Effect of extraction methods on yield, phytochemical constituents and antioxidant activity of Withania somnifera. Arabian J Chem 10:S1193–S1199. https://doi.org/10.1016/j.arabjc.2013.02.015
Kokate CK, Purohit AP, Gokhale SB (2004) Pharmacognosy, 30th edn. Nirali Prakashan, Pune, pp 593–597
Wolfe K, Wu X, Liu RH (2003) Antioxidant activity of apple peels. J Agric Food Chem 51(3):609–614. https://doi.org/10.1021/jf020782a
Ordenez AAL, Gomez JD, Vattuone MA, Isla MI (2006) Antioxidant activities of Sechium edule (Jacq.) swart extracts. Food Chem 97(3):452–458. https://doi.org/10.1016/j.foodchem.2005.05.024
Prieto P, Pineda M, Aguilar M (1999) Spectrophotometric quantitation of antioxidant capacity through the formation of a phosphomolybdenum complex: specific application to the determination of vitamin E. Anal Biochem 269(2):337–341. https://doi.org/10.1006/abio.1999.4019
Brand-Williams W, Cuvelier ME, Berset C (1995) Use of a free radical method to evaluate antioxidant activity. LWT Food Sci Technol 28(1):25–30. https://doi.org/10.1016/S0023-6438(95)80008-5
Jiju V (2015) Evaluation of in vitro anticancer activity of hydroalcoholic extract of Justicia tranquibariensis. Int J Res Pharm Biosci 2(4):10–13
Maqsood M, Qureshi R, Ikram M, Seeraj Ahmad M, Jabeen B, Rafique Asi M, Ahmed Khan J, Ali S, Lilge L (2018) In vitro anticancer activities of Withania coagulans against Hela, MCF-7, RD, RG-2 and INS-1 cancer cells and phytochemical analysis. Integr Med Res 7(2):184–191. https://doi.org/10.1016/j.imr.2018.03.003
Bhat SS, Revankar VK, Kumbar V, Bhat K, Kawade VA (2018) Synthesis, crystal structure and biological properties of a cis-dichlorodobis(diimine)copper(II) complex. Actacryst C74:146–151
Bahuguna A, Khan I, Bajpai VK, Kang SC (2017) MTT assay to evaluate cytotoxic potential of drug. Bangladesh J Pharmacol 12:115–118
Trott O, Olson AJ (2010) AutoDockVina: improving the speed and accuracy of docking with a new scoring function, efficient optimization and multithreading. J Comput Chem 31(2):455–461. https://doi.org/10.1002/jcc.21334
Ponce-Cusi R, Calaf G (2016) Apoptotic activity of 5-FU in breast cancer cells transformed by low doses of ionizing α-particle radiation. Int J Oncol 48(2):774–782. https://doi.org/10.3892/ijo.2015.3298
Anantharaju PG, Gowda PC, Vimalambike MG, Madhunapantula SV (2016) An overview on the role of dietary phenolics for the treatment of cancers. Nutr J 15(1):99. https://doi.org/10.1186/s12937-016-0217-2
Carocho M, Ferreira (2013) The role of phenolic compounds in the fight against cancer – a review. Anticancer Agents Med Chem 13(8):1236–1258. https://doi.org/10.2174/18715206113139990301
Acknowledgements
The authors express sincere thanks to Dr. H. N. More, Principal, Bharati Vidyapeeth College of Pharmacy, Kolhapur, Maharashtra, India, for providing the facilities needed to undertake this research work.
Plant authentication
The plant was identified and authenticated (MB/RW/02/013) by Dr. M. Y. Bachulkar, Ex-Principal and Taxonomist, Department of Botany, Shri Vijaysinha Yadav Arts and Science College, Kolhapur, Maharashtra.
Funding
This research did not receive any specific grant from funding agencies in public, commercial or not-for-profit sectors.
Author information
Authors and Affiliations
Contributions
RAW did the conception of the work, design of the work, experimental work done, interpretation of the data and drafting of the work. RJJ contributed in the design of the work, analysis and interpretation of the data and critical revision of the manuscript for intellectual content. RPD took part in the design of the work, drafting of the work, analysis and interpretation of the data and critical revision of the manuscript for intellectual content. RRJ carried out the visualization of images, analysis and interpretation of the data and critical revision of the manuscript for intellectual content. NSL helped in the experimental work done, interpretation of the data, drafting of the work and visualization of images. The authors have read and approved the final manuscript.
Corresponding author
Ethics declarations
Ethics approval and consent of participate
Not applicable
Consent for publication
Not applicable
Competing interests
The authors declare that they have no competing interest.
Additional information
Publisher’s Note
Springer Nature remains neutral with regard to jurisdictional claims in published maps and institutional affiliations.
Rights and permissions
Open Access This article is licensed under a Creative Commons Attribution 4.0 International License, which permits use, sharing, adaptation, distribution and reproduction in any medium or format, as long as you give appropriate credit to the original author(s) and the source, provide a link to the Creative Commons licence, and indicate if changes were made. The images or other third party material in this article are included in the article's Creative Commons licence, unless indicated otherwise in a credit line to the material. If material is not included in the article's Creative Commons licence and your intended use is not permitted by statutory regulation or exceeds the permitted use, you will need to obtain permission directly from the copyright holder. To view a copy of this licence, visit http://creativecommons.org/licenses/by/4.0/.
About this article
Cite this article
Warake, R.A., Jarag, R.J., Dhavale, R.P. et al. Evaluation of in vitro antioxidant, anticancer activities and molecular docking studies of Capparis zeylanica Linn. leaves. Futur J Pharm Sci 7, 76 (2021). https://doi.org/10.1186/s43094-021-00218-2
Received:
Accepted:
Published:
DOI: https://doi.org/10.1186/s43094-021-00218-2
