- Research
- Open access
- Published:
A Design of Experiment (DoE) based approach for development and optimization of nanosuspensions of telmisartan, a BCS class II antihypertensive drug
Future Journal of Pharmaceutical Sciences volume 6, Article number: 14 (2020)
Abstract
Background
The present study was aimed to enhance the solubility and dissolution of BCS class II drug, telmisartan (TEM), by nanoformulation approach. Several attempts were made to develop a nanosuspension by bottom-up and top-down techniques. In our study, we found in situ nanoamorphization technique to be incompatible and hence was not selected for further development of nanoformulation. Bottom-up techniques such as anti-solvent precipitation and emulsification solvent evaporation methods failed to reduce the size of the drug to nanoform by HPMC E15 and PVP K-25 at 1500–2000 rpm but resulted in micron-sized particles.
Results
However, the acid-base neutralization method has produced nanosuspension with a particle size of 243.9 nm and 0.119 PDI. Formulation and analytical development were carried out by statistical factorial design using the Design-Expert software (version 11.0). The nanosuspensions remained stable even after 90 days without any aggregations with particle size 338.1 nm and PDI 0.146. Zeta potential of optimized formulation was found to be − 16.2 mV. Drug content and its release were estimated by the developed and validated in-house HPLC method. In vitro drug diffusion studies on the optimized formulation have shown a drug release of 82.6% by the end of 3 h, whereas plain drug suspension has shown only 42.8% release, indicating a 2-fold increase of drug diffusion with nanosuspension. Ex vivo drug permeation studies performed using excised goat gastric mucosa revealed much faster permeation of TEM from nanosuspension than the plain drug suspension.
Conclusions
Hence, from the results, it can be concluded that TEM, when formulated by acid-base neutralization method as a nanosuspension, leads to enhanced solubility, dissolution, and stability.
Background
Hypertension, a worldwide epidemic at present, is not a disease in itself rather it is an important risk factor for serious cardiovascular disorders including myocardial infarction, stroke, heart failure, and peripheral artery disease. An estimate of 26% of the world population is suffering from hypertension, and this toll was expected to rise to 29% by 2025 [1]. Telmisartan (TEM), a highly selective angiotensin II (AII) type 1 (AT1) receptor antagonist, is approved for the treatment of hypertension, either as monotherapy or in combination with other antihypertensive agents showing a greater reduction in blood pressure when compared with losartan. It is also effective in terms of reducing blood sugar levels and cholesterol. However, it belongs to BCS class II, which is sparingly soluble in water and has a high log P value [7.7], and thereby it exhibits poor bioavailability and stability [2]. Formulating of TEM as nanosuspensions is an attractive approach, where particles ranging from size 200–500 nm are sterically stabilized by surface stabilizers, resulting in improved saturation solubility, dissolution rate, oral bioavailability, stability, therapeutic efficiency, reduced side effects, and reduced toxicity [3].
Bottom-up and top-down are the methods generally used in the preparation of nanosuspensions. The top-down methods include ball milling and high-pressure homogenization. Combinative technologies are introduced to produce even smaller particles [4]. Media milling, a nanosuspension formulating technique, has a limitation of product contamination due to erosion. A high-pressure homogenization technique consumes high energy. Many hydrophobic drugs are weakly acidic or basic, which thus imparts pH-dependent solubility to them [5].
A literature survey revealed that TEM solubility was enhanced by the nanosuspension approach by the media milling technique; the solution was stirred at 700 rpm for 18 h. By evaporative anti-solvent precipitation technique, the nanocrystals were formulated by a mixture of various surfactants and polymers at 4000 rpm using a mechanical stirrer; further stirring continued for 2 h at 10,000 rpm [6]. The above-stated technique media milling is applicable for laboratory scale and possesses several scalable difficulties for large scale development. Experimentation and optimization were carried out by factorial design which included the selection of variables. HPMC E15 and stirring speed were selected as major factors; particle size and cumulative percentage drug release were opted as responses. Analytical method development for analysis of dissolution samples was performed by opting flow rate and pH as factors and retention time and USP plate count as responses. Hence, the present study was aimed at developing and optimizing TEM nanosuspension by 22 factorial design with midpoints to enhance its solubility, dissolution rate, and hence improved bioavailability.
Methods
Materials
TEM obtained as a gift sample from Connexions Life sciences, Bangalore. HPMC E15 and PVP K-25 were procured from SD Fine-Chem Limited. All the reagents used for analytical development in the study were of analytical grade and were obtained from Sigma Aldrich, Bangalore.
Methods
HPLC method development of TEM
Agilent HPLC (contained UV–VISIBLE detector Model) with the EZChrom Elite software was used for analyzing in vitro dissolution samples and for data collection and integration. A reverse-phase Ecosil-C18 column (250 × 4.6 mm, 5 μm) was used for the TEM chromatographic separation at 25 °C. The flow rate was selected as one of the factors in the experimental design, and it was set at 0.80 to 1.0 ml/min, and detection was done at a wavelength of 291 nm. Twenty microliter was the injection volume [7].
Validation as per ICH guidelines was performed for the developed method to assess various parameters like the specificity in which placebo sample solutions were prepared in the same manner as in sample preparation and were injected into the chromatographic system without TEM at various concentrations, and the chromatogram data was recorded.
Linearity was determined by preparing seven standard TEM solutions with concentrations ranging from 50 to 150% of the target standard concentration were prepared and injected into the chromatographic system, and the coefficient of determination was calculated. The precision of the developed method was confirmed by repeatability and intermediate precision. Intraday and interday analyses were performed by repeating the method for three times in the same day and on three successive days. The absorbance was determined and percentage RSD was calculated; six sample solutions (TEM) were prepared at lower (50%) and higher (150%) levels and three intermediate sample solutions (100%) to assess accuracy.
Robustness was determined by using two mobile phases, one containing 90% acetonitrile and the other containing 110% acetonitrile, and the system suitability parameters were assessed by standard solution injection; flow rate robustness was assessed by increasing the flow rate from 0.8 to 1.0 ml/min. The effect of pH on robustness was assessed by injecting the solutions consisting of the mobile phase of varying pH from 4.4 to 4.7 into the chromatographic system.
Standard and blank solution preparation
The standard solution was prepared by dissolving the drug TEM 40 mg into a 25-ml volumetric flask containing phosphate buffer of 15 ml and acetonitrile of 10 ml (60:40 v/v), sonicated for 5 min, and then filtered through 0.45-μm membrane filter. The concentration of the solution was found to be 1.6 mg/ml. The blank solution was prepared as similar to standard but without the pure drug in the ratio of 60:40% v/v mixture of phosphate buffer and acetonitrile, the same solution used as mobile phase [8].
Sample preparation
The collected dissolution sample was transferred to a 25-ml volumetric flask. The sample was then dissolved and diluted with pH 4.4 phosphate buffer: acetonitrile (60:40 v/v) and subjected to sonication for 10 min, filtered through a 0.45-μm membrane filter [8].
Solubility studies
The solubility studies were performed by placing the pure drug in excess quantity and optimized nanosuspension in two different flasks which consist of 10 ml of distilled water. The samples present in the sealed flasks were placed on the orbital shaker for agitation (Cintex Industrial Corporation, Mumbai) at room temperature for 48 h. Then, the centrifugation of samples was done to separate the undissolved content. The analysis was carried out by the above developed HPLC technique for the quantification of TEM present in the supernatant layer [7].
Drug-excipient compatibility studies
The compatibility between the drug and the excipients (HPMC E15, sodium hydroxide, sodium bicarbonate) was studied via FT-IR, using Bruker alpha E ATR spectrophotometer (KBr pelletization method) [7].
Formulation development of TEM nanosuspensions
Bottom-up anti-solvent precipitation method
Accurately weighed 100 mg of pure TEM was dissolved in 2 ml of solvent (chloroform) at room temperature. The above solution was poured into a beaker having a fixed volume (100 ml) of anti-solvent (water) containing 100 mg of polymer (HPMC E15) at room temperature with a stirring speed of 1500 rpm using mechanical Remi stirrer. The above solution was stirred continuously for 2 h to evaporate the solvent. The formed nanosuspension was transferred into a container and stored at 25 °C until further use. The same procedure was adopted using PVP K-25 as a stabilizer, instead of HPMC E15 [9].
Emulsification solvent evaporation method
To 5 ml of chloroform, 100 mg of TEM was added and dissolved at room temperature. The resulting solution was added into a 50 ml aqueous solution of 100 mg HPMC E15 at the same temperature under high-speed homogenization (8000 rpm) for 5 min. After homogenization, the preparation was subjected to ultrasonication for 15 min, followed by mechanical stirring (10 min) for the evaporation of the organic solvent. The nanosuspension was obtained after centrifugation for 10 min at 4000 rpm. The same procedure was adopted using PVP K-25 as a stabilizer instead of HPMC E15 [10].
Acid-base neutralization method
TEM (100 mg) was weighed and dissolved in 5 ml mixture of hydrochloric acid solution (3 N) and chloroform (1:5 v/v). HPMC E15 was dispersed in 100 ml of sodium hydroxide (0.0375 N, 1% w/v) solution. The acidic drug solution was added dropwise to the sodium hydroxide solution under moderate stirring (1500 rpm) for 1 h to produce the nanosuspension [11].
The selected drug is highly lipophilic. The solubility of the drug in aqueous solutions is strongly pH-dependent, with maximum solubility observed at high and low pH. In the pH range of 3–9, it is poorly soluble. According to the Henderson-Hasselbalch equation, an alteration of 1 unit in pH value will cause 10 times to change in solubility of weak electrolyte drugs [12]. It is possible to accomplish an acid-base neutralization method. The formulations produced nanosized particles by opting the acid-base neutralization method.
Experimental design
Based on the literature survey and trials, the acid-base neutralization method was further selected for the formulation of TEM nanosuspensions. From the preliminary experimental trials, it was observed that with a change in speed (1500–2000 rpm) there was no change in particle size. However, change in the stirring time resulted in reduced particle size. It was also observed that stabilizer concentration (HPMC E15) and speed of stirring [13] were major factors that affected the formation of nanosized particles. Particle size and in vitro drug release were selected as responses. Hence, the above parameters were selected as factors and experimented with low and high levels by opting 22 factorial design with midpoint using the Design-Expert software (version 11).
Particle size and Zeta potential
The particle size and Zeta potential of nanosuspensions were measured using HORIBA SCIENTIFIC SZ-100 ZETA SIZER at 25 °C. The samples were diluted (1:500) prior to analysis with distilled water and were measured in triplicates [7].
Drug content
Nanosuspension equivalent to 40 mg of drug was transferred into a 25-ml volumetric flask consisting of chloroform: methanol (1:5 v/v), and the flask was shaken for 20 min and was filtered. The filtrate was diluted using 0.1 N HCl: methanol (1:9 v/v), and the drug content was estimated by the above developed HPLC method [7].
In vitro drug release studies
The dissolution study of nanosuspension has been performed by using USP type–II, paddle apparatus. The accurately measured volumes of nanosuspension (5 ml) were transferred into the dissolution apparatus (Electrolab TDT-08 L, India) consisting of 900 ml of 0.1 N HCl which served as medium and operated at a speed of 50 rpm at 37 ± 0.5 °C. Five milliliters of the sample was withdrawn periodically and replaced with an equal volume of fresh medium up to 12 min. Collected samples were then filtered using the 0.1-μm PTFE syringe filter [7] (Whatman Inc., Clifton., USA).
Scanning electron microscopy (SEM)
Scanning electron microscopy (SEM, Thermo Fisher Scientific India Private Ltd., Mumbai, India) studies were conducted to study the morphology of suspended nanoparticles. The sampling cell contained a thin film of a nanosuspension solution. At × 300 magnification, images were taken with Zeiss tabletop scanning electron microscopy [7].
Stability
As per ICH Q1A (R2) guidelines, the stability studies were performed for the optimized formulations. The formulations were placed in bottles and stored at 40° ± 2 °C/75 ± 5% RH and evaluated for changes in particle size at the end of 30, 60, and 90 days [14].
In vitro drug diffusion studies
Franz diffusion apparatus was used to perform diffusion studies. A fresh goat mucosa was collected from a local slaughter shop, within an hour of excision and was taken into the lab in normal saline and used as a biological membrane. TEM equivalent to 100 mg nanosuspension was placed on the biological membrane fixed to the diffusion apparatus; 0.1 N HCl was used as a diffusion medium maintained at 37 ± 0.5 °C and rotated at 50 rpm. At predetermined time intervals, 3 ml of samples was withdrawn and replaced with the fresh medium and analyzed the drug concentration by the above developed HPLC method. The study was conducted for both plain suspension and TEM nanosuspension [15].
Ex vivo permeability studies
A fresh goat mucosa was collected from local slaughter shop (Anantapuramu, Andhra Pradesh, India), within an hour of excision and was taken into the lab in normal saline. The collected mucosa was cleaned properly and with continuous aeration; at 37 °C, the tissue was placed in an organ bath. The organ tube (receptor compartment) filled with 30 ml of 0.1 N HCl. At predetermined time intervals, 3 ml of samples was withdrawn and replaced with fresh medium and analyzed the drug concentration by the developed HPLC technique. The study was conducted for both plain suspension and TEM nanosuspension [15].
The organ tube (beaker with 30 ml of 0.1 N HCl) used as a receptor compartment. A part of the tissue in the form of a sac filled with TEM nanosuspension and placed in an organ tube with continuous aeration to study the permeation of drug (ex vivo permeability studies mimics the in vivo behavior by aeration to assess the permeation of drug). In vitro diffusion and ex vivo permeability studies were the methods to study the amount of drug that diffuses or permeates at a given time which serves as alternate to in vivo studies and provides information to conduct in vivo studies.
Results
HPLC method development of TEM
The optimization for analytical development was performed by selecting flow rate and pH as factors and retention time and USP plate count as responses. Initial trials with the change in the composition of the mobile phase, pH, and flow rate resulted in 3 min retention time; hence, the run time of the sample was fixed at 10 min. The absorbance was measured at 291 nm. Twenty microliter was the injection volume. Standard and sample solution was injected separately into HPLC, and major peak areas were recorded. The peak areas were taken to quantitate the amount of drug present in the sample. Further, based on the amount of TEM percentage, cumulative percentage drug release was calculated. No interferences were observed for placebo and diluents of the sample at TEM retention times that confirmed specificity. The R2 value was 0.999 which exhibited that the calibration curve was linear in the concentration range of 150–450 μg/ml (Fig. 1). Relative standard deviation (RSD), theoretical plates, and tailing factor were found to be 0.15%, 7651, and 1.82%. Assay values of the drug were in the range of 97.5 to 98.6% that indicated the developed method was precise. Accuracy results revealed that at each level the average recovery was between 96.8%, 97.2%, and 98.2% with RSD as ≤ 1% that confirmed the accuracy. System suitability results revealed that the developed method was robust with slight variations.

Linearity graph of telmisartan
Solubility studies
In comparison to the plain TEM, there was an exponential increase in saturation solubility (0.1 N HCl). The optimized nanosuspension and plain TEM exhibited 0.0438 mg/ml and 0.0089 mg/ml solubility, respectively, in 0.1 N HCl, an almost 5-fold increase in solubility of nanosuspension upon comparison with TEM plain drug.
Drug-excipient compatibility studies
The spectrum of pure TEM showed a distinct absorption band for the carbonyl group C=O at 1695.90 cm−1 and the O–H band at 3060.85 cm−1. The spectra with sodium bicarbonate and TEM showed a change in the C=O bond that the frequency of C=O was shifted from 1695.90 to 1722.52 cm−1. It is an indication of strong hydrogen bonding interactions, and it has shown incompatibility with the drug.
HPLC experimental design and optimization
Flow rate and pH were selected as factors set at 0.8 to 1.0 ml/min and 4.4 to 4.7, respectively. Retention time and USP plate count were selected as responses.
Retention time
The mode F value of 107.77 implied the model was significant; there is only a 0.01% chance that a model F value this large could occur due to noise. Values of Prob > F, less than 0.05, indicated model terms are significant (Table 1).
In this study, A, B, and AB were significant model terms. The pre R2 of 0.9374 was in reasonable agreement with the adj R2 of 0.9697. An adequate precision ratio greater than 4 is desirable. The ratio of 24.193 indicated an adequate signal. This model can be used to navigate the design space. Retention time data was analyzed and exhibited a negative coefficient for flow rate and a positive coefficient for pH (Table 2). A positive sign represents the synergistic effect and a negative sign with an antagonistic effect. Retention times of samples were recorded and were within 2–3 min.
USP plate count
It was observed that the effects were above the t value indicated significant factors. The model F value of 28.19 implied that the model was significant. In this case, A, B, and AB were significant model terms where Prob > F was less than 0.0500 (Table 3). The pred R2 of 0.9334 was in agreement with the adj R2 of 0.8908. The adequate precision ratio of 27.272 indicated an adequate signal in which this model can be used to navigate the design space. Flow rate and pH exhibited a positive effect. From the interaction plots, it was displayed that relative slopes of the factors exhibited significant interaction flow rate and pH.
Optimized formula (analytical development)
After ANOVA and contour plot analysis (Fig. 2), the design yielded 12 best formulations with predicted values. Based on the desirability (> 0.990), the above formulation Table 4 was selected, and experimentally the study was conducted. The results were recorded and exhibited closeness in theoretical and experimental values, hence selected as an optimized formula.

Contour plot showing the effect of flow rate and pH on retention time and USP plate count
Formulation development of TEM nanosuspensions
The nanoparticles formulated by bottom-up anti-solvent precipitation method and emulsification solvent evaporation methods exhibited an average particle size of 1067 nm and 1377.1 nm, respectively, and micronized particles with PI of 0.352 and 0.619, respectively. Hence, these methods were not selected for further study.
Surface stabilizers were selected by determining the particle size of the formulated nanosuspensions with HPMC E15 and PVP. But by PVP, the particle size could not be reduced to below 500 nm; hence, HPMC was selected to further carry out DoE in which the concentrations of HPMC were set from 0.5 to 1.0 mg.
Experimental design (formulation development)
Based on the number of factors and levels, 22 factorial design with a midpoint was selected to investigate their effects using the Design-Expert software (version 11) (Table 5). The design contained experimental 8 runs which included 22 factorial design and mid-levels. The prepared TEM nanosuspension by all the mentioned above three methods was found to be milky white without any signs of interactions.
Particle size and Zeta potential
The particle size of nanosuspension ranged from 243.9 to 565.5 nm and PDI in the range of 0.119 to 0.450. These nanosized formulations developed by acid-base neutralization method enhanced solubility and dissolution rate. Zeta potential of the optimized formulation was found to be − 16.2 mVs (Fig. 3)

Particle size analysis and Zeta potential of stabilized formulation by acid-base neutralization method after 90 days
Particle size
The model F value of 2152.42 implied the model was significant; there was only a 0.01% chance that a model F value this large could occur due to noise. Values of Prob > F, less than 0.05, indicated model terms are significant (Table 6). In this study, A, B, and AB were significant model terms. The pre R2 of 0.9995 was in reasonable agreement with the adj R2 of 0.9985. An adequate precision ratio greater than 4 is desirable. The ratio of 204.162 indicated an adequate signal. This model can be used to navigate the design space. Particle size data was analyzed and exhibited a negative coefficient for HPMC E15 and the positive coefficient for stirring speed (Table 7). A positive sign represents the synergistic effect and a negative sign with an antagonistic effect. From the interaction plots, it was displayed that relative slopes of the factors exhibited significant interaction with HPMC E15 and speed.
Drug content
Drug content for all the formulations ranged from 95.7 to 99.8% and met the specifications as per I.P.
In vitro drug release
It was observed that the effects were above the t value indicated significant factors. The model F value of 66.01 implied that the model was significant. In this case, A, B, and AB were significant model terms where Prob > F was less than 0.0500 (Table 8). The pred R2 of 0.8993 was in agreement with the adj R2 of 0.9512. The adequate precision ratio of 19.715 indicated an adequate signal in which this model can be used to navigate the design space. HPMC E15 exhibited positive sign, and stirring speed exhibited a negative effect.
The formulations, F1 to F5, exhibited drug release in the range of 60.5 to 100.2% (Fig. 4).

Cumulative percentage release of drug from formulations F1 to F5. Values were expressed mean ± SD, n = 6
Optimized formula (formulation development)
After ANOVA and contour plot analysis (Fig. 5), the design yielded 10 best formulations with predicted values. Based on the desirability (> 0.990), the above formulation Table 9 was selected, and experimentally the study was conducted. The results were recorded and exhibited closeness in theoretical and experimental values, hence selected as an optimized formulation.

Contour plot showing the effect of HPMC E15 and stirring speed on particle size and cumulative percentage drug release
Stability
The nanosuspensions remained stable even after 90 days (nanosize) without any aggregations with a particle size of 338.1 nm and PDI 0.146.
In vitro drug diffusion studies
TEM plain drug suspension was prepared by dispersing 40 mg of the drug in 3 ml of distilled water. After 3 h, 82.6% of the drug was diffused from TEM nanosuspension, and plain drug suspension diffused 42.8%, an indicator of almost 2-fold increase in diffusion.
Discussion
Saturation solubility studies revealed that nanosizing of TEM produced a significant increase in solubility. The overall increase in saturation solubility in all media could be attributed to the increased dissolution pressure which was described by the Ostwald-Freundlich equation which correlates particle size with saturation solubility and states that with decreasing particle size the dissolution pressure increases thereby increasing the saturation solubility of the solute. FT-IR spectra of optimized TEM nanosuspension showed carbonyl group at 1641.16 cm−1 and disappearance of O–H band; it was due to interaction with HPMC E15, indicated the formation of strong protective polymer stabilizer coat over drug nanoparticles to prevent the aggregation. It can be confirmed that the drug was compatible with sodium hydroxide. Retention behavior changes with a change in the pH of the buffer. The drug is nonpolar, and its elution was influenced by the mobile phase (polar). The flow rate and pH were adjusted, and it was observed that an increase in flow rate reduced the retention time; hence, the parameters were optimized to exhibit a high flow rate. An increase in pH increased USP plate count; hence, higher pH is selected. Further, an increase in flow rate and pH gave better symmetric resolved peaks without tailing to yield shorter retention time and increased USP plate count. Initial screening studies indicated the change in particle size by change in stirring speed. Hence, the concentration of HPMC and stirring speed were identified as critical formulation parameters. Particle size and cumulative percentage drug release were identified as responses. The enhanced solubility and dissolution rate by acid-base neutralization method might be due to the formation of nanosized particles. Zeta potential of optimized formulation indicated macroscopic stability of suspensions as the value was within ± 30 mVs.
It has been observed that an increase in the concentration of HPMC E15 decreased particle size and increased drug release, and increase in stirring speed increased particle size and decreased drug release. Both the particle size and PI value decreased significantly with the increase in stabilizer concentration. Although the particle size increased when the total stabilizer concentration increased from 1.0%, there were no significant differences. The concentration of stabilizer is important to the successful production nanosuspensions, which means that a sufficient amount of stabilizer must adsorb onto the particle surface to provide a barrier to agglomeration. By intermolecular hydrogen bonds formation between TEM and HPMC E15, crystal growth was inhibited. By the mechanism of electrostatic, steric forces, and by undergoing adsorption of the HPMC E15 at the surface of the drug, by rapid nucleation and formation of the metastable zone, the creation of turbulence by mechanical stirrer leads to the prevention of crystals formation. An increase in Gibbs free energy, reduction of particle size, and enhanced solid-liquid interfacial area produced thermodynamically stable TEM nanosuspension. Both particle size and PDI decreased at 1500 rpm on further increasing the speed; the particle size increased due to damage to the stabilizer layer and might have induced agglomeration. In the present study, chloroform was selected as the solvent due to its higher solubilization potential for TEM and high volatility. Rapid evaporation of the solvent is thus possible which results in higher supersaturation and rapid nucleation, all prerequisites for ultra-fine crystal size. Hydrophilic polymers used as stabilizers stabilized the nanoparticles by steric stabilization. Pareto chart is a useful tool to identify statistically significant effects by t value limits; the effects were above the t value indicated factors were significant. The normal probability plot residuals followed a normal distribution and followed a straight line. It was evident from the plots of residuals versus predicted and residuals versus run that error terms were not associated with one another, and it adequately showed that the model fits the data obtained from software. Predicted versus actual plot data points exhibited a split by the 45° line indicated significance. Cook’s distance provides valuable information regarding the measurement of regression effect changes if the case is deleted, large values should be identified which were produced by recording errors and should be corrected. In this case, no large values were observed; it indicated the data without any errors (Fig. 6). SEM analysis indicated that particles were nearly spherical and were in the nano range (Fig. 7). TEM plain drug suspension was prepared by dispersing 40 mg of the drug in 3 ml of distilled water. Enhanced diffusion from TEM nanosuspensions might be due to increased solubility and dissolution rate of the drug in nanoform which might improve bioavailability (Fig. 8a). Permeation studies proved that after 3 h of diffusion, 85.3% of drug diffused from TEM nanosuspension and plain drug suspension diffused 40.6% (Fig. 8b). It clearly showed that the drug permeation from TEM nanosuspension was much faster than plain drug suspension; it is a clear indicator for enhancement in bioavailability. It indicated that the presence of TEM in nanoform and with suitable adsorption of stabilizers improved the permeation than plain drug suspension which is a clear indicator for enhanced stability and bioavailability.

Statistically significant plot effects of responses. a Pareto chart. b Normal probability plot residuals. c Residuals versus predicted. d Residuals versus run. e Predicted versus actual plot. f Cooks distance
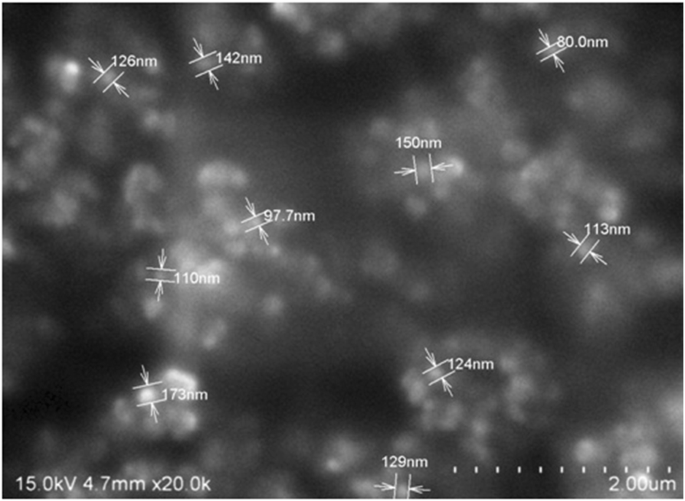
SEM image exhibiting morphology and particle size

Cumulative percentage drug diffused. a Ex vivo diffusion studies. b Ex vivo permeation studies. Values were expressed mean ± SD, n = 3
Conclusion
The formulated and optimized TEM nanoformulation upon further evaluation (in vivo studies) might be useful to effectively treat hypertension with enhanced bioavailability which is commonly prescribed (TEM) by the prescribers rather than in the form of tablets that are available in the market. The study can be extensively studied and developed by computational algorithmic artificial neural network technology and by molecular dynamic and simulation studies to further optimize the formulation at lower cost with in-built quality.
Availability of data and materials
All data and material are available upon request.
Abbreviations
- Adj:
-
Adjusted
- DoE:
-
Design of experiment
- df:
-
Degrees of freedom
- HPLC:
-
High-performance liquid chromatography
- HPMC E15:
-
Hydroxypropyl methylcellulose
- PDI:
-
Poly Dispersity Index
- Pre:
-
Predicted
- Prob:
-
Probability
- PTFE:
-
Polytetrafluoroethylene
- PVP K-25:
-
Polyvinylpyrrolidone
- TEM:
-
Telmisartan
References
Chockalingam A, Campbell NR, Fodor JG (2006) Worldwide epidemic of hypertension. Can J Cardiol 22(7):553–555
Bajaj A, Rao MR, Pardeshi A, Sali D (2012) Nanocrystallization by evaporative antisolvent technique for solubility and bioavailability enhancement of telmisartan. AAPS pharmscitech 13(4):1331–1340
Xu Y, Liu X, Lian R, Zheng S, Yin Z, Lu Y (2012) Enhanced dissolution and oral bioavailability of aripiprazole nanosuspensions prepared by nanoprecipitation/homogenization based on acid-base neutralization. Int J Pharm 438(1-2):287–295
Chen H, Khemtong C, Yang X, Chang X, Gao J (2011) Nanonization strategies for poorly water-soluble drugs. Drug Discov Today 16(7-8):354–360
Kocbek P, Baumgartner S, Kristl J (2006) Preparation and evaluation of nanosuspensions for enhancing the dissolution of poorly soluble drugs. Int J Pharm 312(1-2):179–186
Rao M, Bajaj A (2014) Study of effect of variables on particle size of telmisartan nanosuspensions using box-Behnken design. Drug Res 64(12):663–667
Vuppalapati L, Cherukuri S, Neeli V, Reddy Yeragamreddy P, Reddy Kesavan B (2016) Application of central composite design in optimization of valsartan nanosuspension to enhance its solubility and stability. Curr Drug Deliv 13(1):143–157
Peraman R, Kalva B, Reddy YP, Sharma H (2016) Analytical quality by design approach in selection of method variables for simultaneous analysis of ciprofloxacin and hydrocortisone by LC method using Taguchi method. Anal Chem Lett 6(1):1–12
Liu D, Xu H, Tian B, Yuan K, Pan H, Ma S (2012) Fabrication of carvedilol nanosuspensions through the anti-solvent precipitation–ultrasonication method for the improvement of dissolution rate and oral bioavailability. AAPS Pharmscitech 13(1):295–304
Hoa LTM, Chi NT, Nguyen LH, Chien DM (2012) Preparation and characterisation of nanoparticles containing ketoprofen and acrylic polymers prepared by emulsion solvent evaporation method. J Exp Nanosci 7(2):189–197
Daebis N, El-Massik M, Abdelkader H (2015) Formulation and characterization of itraconazole oral nanosuspension: methyl cellulose as promising stabilizer. Ely J Pharm Res 1(1):102
Lindfors L, Skantze P, Skantze U, Rasmusson M, Zackrisson A, Olsson U (2006) Amorphous drug nanosuspensions - inhibition of Ostwald ripening. Langmuir 22(3):906–910
Sun W, Mao S, Shi Y, Li LC, Fang L (2011) Nanonization of itraconazole by high pressure homogenization: stabilizer optimization and effect of particle size on oral absorption. J Pharm Sci 100(8):3365–3373
Ahuja BK, Jena SK, Paidi SK, Bagri S, Suresh S (2015) Formulation, optimization and in vitro–in vivo evaluation of febuxostat nanosuspension. Int J Pharm 478(2):540–552
Thakkar HP, Patel BV, Thakkar SPJJoP, Sciences B (2011) Development and characterization of nanosuspensions of olmesartan medoxomil for bioavailability enhancement. J Pharm Bioallied Sci 3(3):426.
Acknowledgements
The authors thank DIST-FIST facility, RERDS-CPR, Raghavendra Institute of Pharmaceutical Education and Research for providing necessary facilities to carry out the research work.
Funding
Not applicable.
Author information
Authors and Affiliations
Contributions
E Bhargav (EB), G Chaithanya Barghav (GB), Y Padmanabha Reddy (YP), P Ramalingam (PR), C. Haranath (CH), Chintamaneni Pavan kumar (CP)
EB and CP designed the work, title based on literature survey. GB assisted in literature survey and formulation development. The work was started by screening the variables and studying its impact on responses. EB, YP, and CH assisted in formulation design by experimental software (Design expert Version 11) for experimentation. It was optimized by identifying the better formula with cost effectiveness and by contour plots. PR assisted on usage of the Design expert software (version 11), widely used software for optimization with regulatory acceptability, interpretation of analytical data work, and statistical data. EB interpreted the formulation and analytical data. GB performed ex vivo studies. After completion of studies, the manuscript writing was carried out. The work was finally drafted and revised. CP helped in manuscript writing and drafting. All authors have read and approved the manuscript.
Corresponding author
Ethics declarations
Competing interest
No competing interests to declare.
Ethics approval and consent to participate
Not applicable
Consent for publication
Not applicable
Additional information
Publisher’s Note
Springer Nature remains neutral with regard to jurisdictional claims in published maps and institutional affiliations.
Rights and permissions
Open Access This article is licensed under a Creative Commons Attribution 4.0 International License, which permits use, sharing, adaptation, distribution and reproduction in any medium or format, as long as you give appropriate credit to the original author(s) and the source, provide a link to the Creative Commons licence, and indicate if changes were made. The images or other third party material in this article are included in the article's Creative Commons licence, unless indicated otherwise in a credit line to the material. If material is not included in the article's Creative Commons licence and your intended use is not permitted by statutory regulation or exceeds the permitted use, you will need to obtain permission directly from the copyright holder. To view a copy of this licence, visit http://creativecommons.org/licenses/by/4.0/.
About this article

Cite this article
Bhargav, E., Chaithanya Barghav, G., Padmanabha Reddy, Y. et al. A Design of Experiment (DoE) based approach for development and optimization of nanosuspensions of telmisartan, a BCS class II antihypertensive drug. Futur J Pharm Sci 6, 14 (2020). https://doi.org/10.1186/s43094-020-00032-2
Received:
Accepted:
Published:
DOI: https://doi.org/10.1186/s43094-020-00032-2